What hashrate is and how it’s measured
Hashrate is the number of attempts per second that miners across the entire network make to find a new block. A miner cycles through numbers and computes a hash for each one, a short digital fingerprint of the block’s data. A block is accepted when its hash falls below a threshold set by the network.
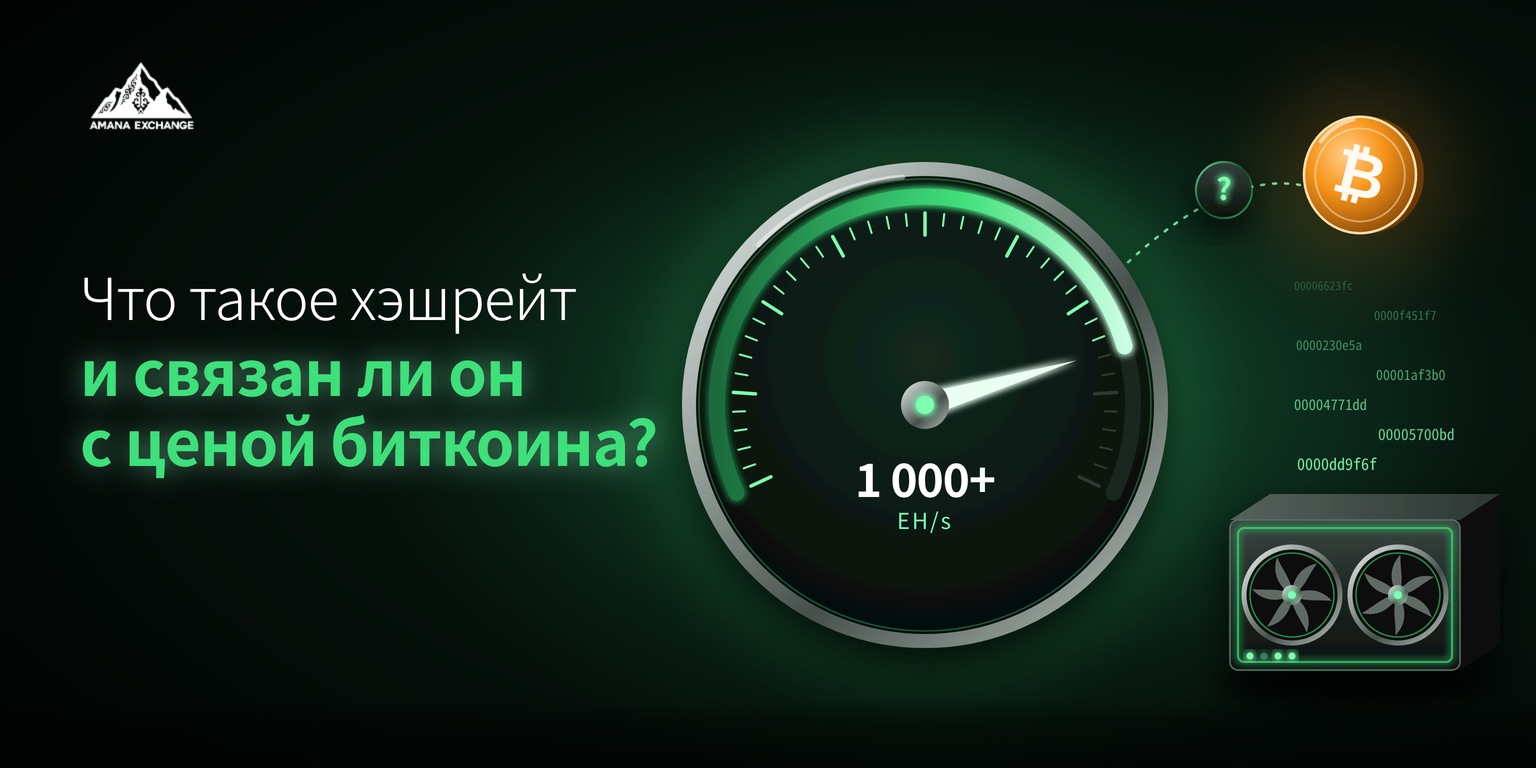
The bitcoin network’s power is measured in exahashes per second (EH/s). One EH/s equals a quintillion attempts per second. The network crossed that mark in January 2016, and on September 2, 2025, the 7-day average exceeded 1 ZH/s (a zettahash, 1,000 EH/s) for the first time. As of October 2, 2026, hashrate stands at around 969 EH/s, with difficulty at 132.76 T. That means the network’s power has grown almost a thousandfold in ten years.
However, rising hashrate doesn’t speed up coin issuance. Every 2,016 blocks, roughly every two weeks, the network recalculates difficulty, the threshold a hash has to meet. As power grows, so does difficulty, so a block is still produced every 10 minutes on average. Put simply, new machines don’t bring more bitcoin, just tougher competition for the same reward.
[Screenshot: 10-year bitcoin hashrate chart on a logarithmic scale]
Why hashrate is called the network’s defense
Hashrate shows how much power anyone wanting to attack bitcoin would need to assemble. The main threat here is a 51% attack. A participant controlling the majority of hashpower can rewrite recent blocks and spend the same coins twice. The higher the hashrate, the more expensive such an attack becomes. At ~950 EH/s, an attacker would need equipment and electricity on the scale of an entire country.
The network’s weak spot is the concentration of hashpower in pools. A pool brings miners together so they find blocks jointly and earn more steady income. This results in a low Nakamoto coefficient, the minimum number of participants who together could control more than half of the hashpower. For bitcoin it stands at 3: collusion among the three largest pools would be enough to exceed 50%.
In practice, the risk is lower than it looks on paper. A pool doesn’t own the hashpower; it aggregates it from thousands of independent miners, who can switch to another pool within minutes. The 51% threshold has been crossed only once, in 2014, when the GHash.io pool briefly surpassed it. No attack followed, but miners started leaving the pool. It seems the network is protected not just by raw power but by miners’ readiness to switch pools quickly.
[Diagram: hashrate distribution across the largest pools with the 51% threshold marked]
Hashrate follows price
Hashrate depends on mining profitability, which is driven primarily by bitcoin’s price. Profitability is measured by hashprice, a miner’s revenue per unit of hashpower per day. It is determined by four factors: BTC price, network difficulty, block subsidy and transaction fees. As long as hashprice stays above electricity and equipment costs, miners plug in new machines. Once it drops below, the least efficient shut down.
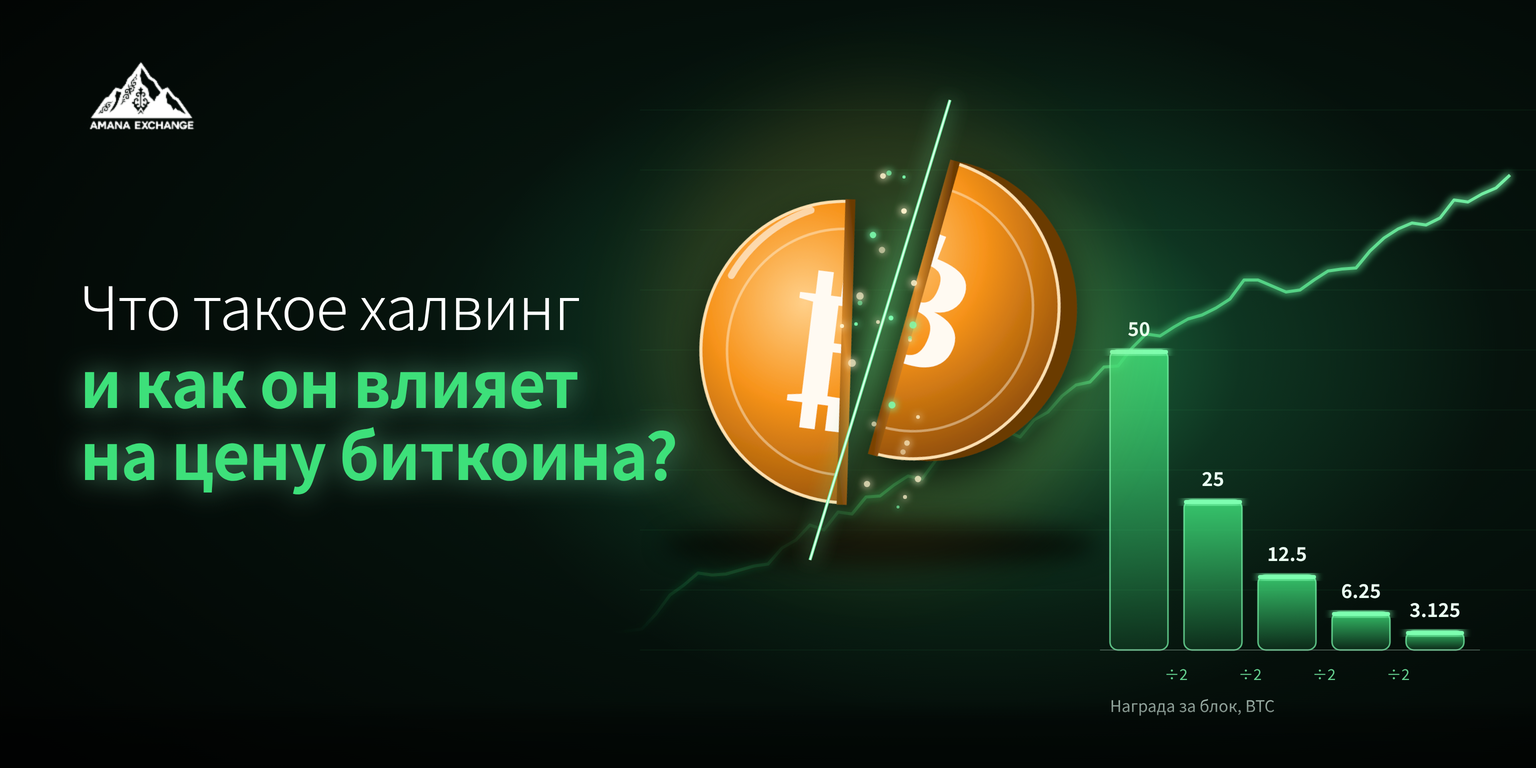
The block subsidy is periodically cut by the halving, a scheduled 50% reduction roughly every four years. Since the April 2024 halving, it has stood at 3.125 BTC, or about 450 BTC per day across ~144 blocks.
In 2026, this whole chain played out clearly. Bitcoin fell from about $126,000 in October 2025 to ~$65,000 by February 2026, and hashprice dropped to a record low of ~$27.89 per PH/s per day. According to CoinShares, public miners’ cost of production in Q2 2026 was about $75,500 per BTC. So many of them were mining coins for more than they were worth on the market.
Research confirms the direction of this relationship. In a 2020 study published by MDPI, price led changes in hashrate by one to six weeks. In other words, the market moves first, and miners follow.
Why hashrate can rise while price falls
This link doesn’t work quickly, though. Hashpower comes online with a delay: mining equipment is ordered months before delivery, and machines bought in a rising market arrive and start up in a falling one. On top of that, newer models use less electricity per unit of hashpower. At the same price, they stay profitable where older ones are already running at a loss.
Hence hashrate’s slow and weak response to falling prices. In Q1 2026, the 30-day figure declined only from 1,066 to 1,004 EH/s, or 5.8%, mainly because old equipment was switched off. Over the same period, the leading cryptocurrency lost almost half its value.
Sources even disagree on hashrate’s peak: about 1.15 ZH/s in October 2025 or ~1,066 EH/s in December 2025. The discrepancy comes down to the averaging period, since daily values swing more than weekly or monthly ones. That’s why news of a “hashrate record” on its own says little about either the network or the price.
When a hashrate drop hits the market
Still, there are moments when hashrate does affect the market. This happens when a drop is sharp and forces miners to sell mined coins to cover costs. Those sales add supply and worsen sentiment.
The biggest example is China in 2021. At the time, the country accounted for more than 60% of network hashpower. After the mining ban, hashrate fell from ~181 EH/s in mid-May to ~85 EH/s on July 3, and difficulty dropped by 28%. Over that period, bitcoin slid from a peak above $60,000 in April to ~$34,000. Yet the price had already crashed in May, before the mass shutdowns. China amplified the decline but didn’t trigger it.
A mass shutdown of machines combined with a sell-off of coins is called miner capitulation. According to Charles Edwards, creator of the Hash Ribbons indicator, hashrate drops by 10–40% during such periods. The indicator signals capitulation when the 30-day moving average of hashrate falls below the 60-day. In June 2022, after such a signal, BTC fell from $30,000 to $20,000.
Not every hashrate drop is market-related. In February 2026, difficulty fell by 11.16%, the largest drop since 2021. The cause was Winter Storm Fern in the US, which briefly knocked out ~60% of the hashpower of the largest pool, Foundry USA. Such hashpower comes back as soon as power is restored, so dips like this seem to say almost nothing about miners’ condition.
[Screenshot: Hash Ribbons indicator with the 2021 and 2022 capitulation periods marked]
Russia and Kyrgyzstan on the mining map
Most hashpower is concentrated in the US, Russia and China. In Q3 2026, the US accounted for ~37% of hashrate, Russia ~17% and China ~12%, despite its mining ban. Judging by China’s share, the ban never fully stopped mining.
Russia restricts mining by region. Restrictions have been extended to Moscow, the Moscow region and part of the Kursk region, and since January 1, 2026, a year-round ban has been in effect in ten regions.
Kyrgyzstan is among the fastest-growing markets: over the year, its hashrate grew from 1 to 4 EH/s, up 300%. But that’s still less than 0.5% of the entire network’s power. The high growth rate seems to be explained mainly by a low base in previous years.
How a holder should read hashrate
For a bitcoin holder, hashrate is more useful as a gauge of miners’ health than as a trading signal. It’s best to watch the 30-day average, since daily values swing by 10–20% due to random fluctuations and weather. The Winter Storm Fern episode shows how misleading a short dip can be.
Steady hashrate growth means miners are investing in the network. It’s a sign of reliability, but not a promise of higher prices: as we’ve seen, hashpower follows the market rather than leading it. A sharp drop combined with low hashprice is a different story. That combination signals stress among miners and is a reason for caution. Even at ~$40 per PH/s per day in September 2026, many of them were operating around breakeven or at a loss. It seems the industry still has little margin of safety.