In a single week in September 2026, spot Bitcoin ETFs pulled in $2.4 billion, while back in June the funds bled money for seven straight weeks as BTC dropped to $59,023. Numbers like these are what the “inflows push the price up, outflows push it down, and institutions have calmed Bitcoin down” narrative in the community rests on. That claim actually bundles together three separate statements, and each one deserves to be checked on its own — against data we pulled together for this article from Kaiko, Glassnode, SoSoValue, and SSRN.
Why ETFs Became the Main Channel for New Money
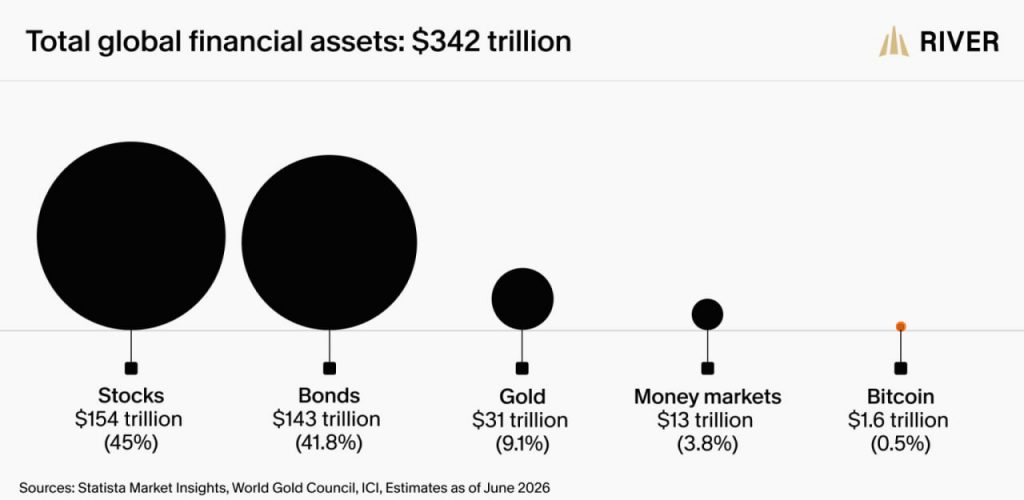
As of August 2026, Bitcoin makes up 0.5% of global financial assets. The remaining 99.5% sits in stocks, bonds, and cash, and most of that money can only reach BTC through familiar, regulated instruments. That’s why, for this pool of capital, ETFs are the main door into the market.
Funds currently hold $102.5 billion in assets under management (AUM). That’s 6.29% of BTC’s market cap — roughly one in every sixteen coins. Demand for the funds is tracked through net flows — the difference between money invested and money withdrawn over a period.
📊 The “ETF = institutions” formula is about 40% undermined by 13F filings — the quarterly position disclosures large managers are required to submit in the U.S. Among classic U.S. ETFs, 13F filers account for only about 60% of Bitcoin ownership. The rest belongs to individual investors.
By July 13, 2026, the funds’ net flows were down $5.8 billion, and within a little over two months they had swung back into positive territory. This raises the article’s central question: what is this money actually doing to price and volatility?
How ETFs Moved Bitcoin Trading Into New York Hours
When an investor buys shares of a spot ETF, new shares are created by authorized participants (APs) — large brokers and market makers with an agreement with the fund. To back those new shares, APs buy additional BTC on the spot market. On outflows, the process runs in reverse: shares are redeemed, coins are sold.
Funds calculate their net asset value per share (NAV) using a benchmark. The reference rate is computed over a one-hour window before the New York close at 4:00 PM, which is why AP trading activity concentrates in those hours. In effect, the U.S. exchange’s schedule has become the spot Bitcoin market’s schedule.
The shift shows up clearly in trading structure. The U.S. session’s share of global spot volume rose to 47%, up from 38% before the ETFs launched, while weekends’ share of volume fell from 28% in 2019 to 16% in 2024.
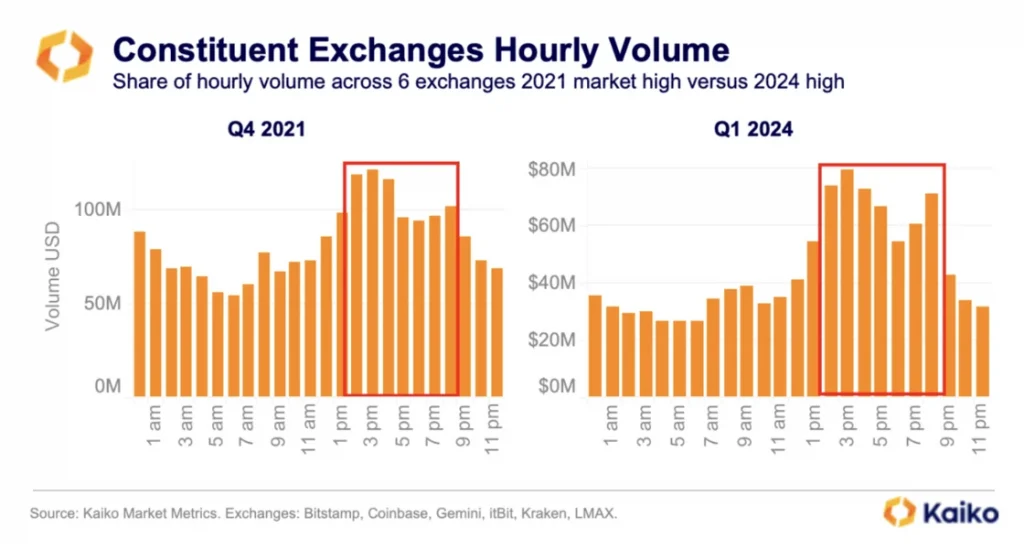
💬 Nearly half of all spot trades now happen during the U.S. session (13:00–22:00 UTC). In Bishkek time, that’s evening and night — 7:00 PM to 4:00 AM.
The flip side of this data is that concentrated liquidity can amplify volatility outside the U.S. session, and this hits retail traders the hardest. Predicting when the market is most liquid has become easier. ❗️ But nights, weekends, and U.S. holidays remain thin: there are fewer orders during these hours, making the price easier to move.
Do Inflows Drive the Price, or Does the Price Drive Inflows?
The observation “inflows mean a rise, outflows mean a drop” is statistically confirmed, but the relationship runs in both directions. A study on SSRN covering 313 trading days found that ETF flows explain 21% of daily variation in BTC returns and predict the following day’s return.
The reverse is also true: returns predict subsequent flows. This means one variable helps forecast the other, but it doesn’t prove that one causes the other. So the data doesn’t actually support the claim that inflows push the price — with the same statistical strength, price pulls in inflows.
The study’s authors find the explanation in the persistence of flows. Each daily inflow impulse is temporary, but flows arrive in series, with new impulses landing before the previous ones fade. Added together, this produces a sustained price drift — roughly 0.96% for every $100 million of inflow over 10 days. The same mechanism also produces “self-reinforcing” streaks of inflows and outflows.
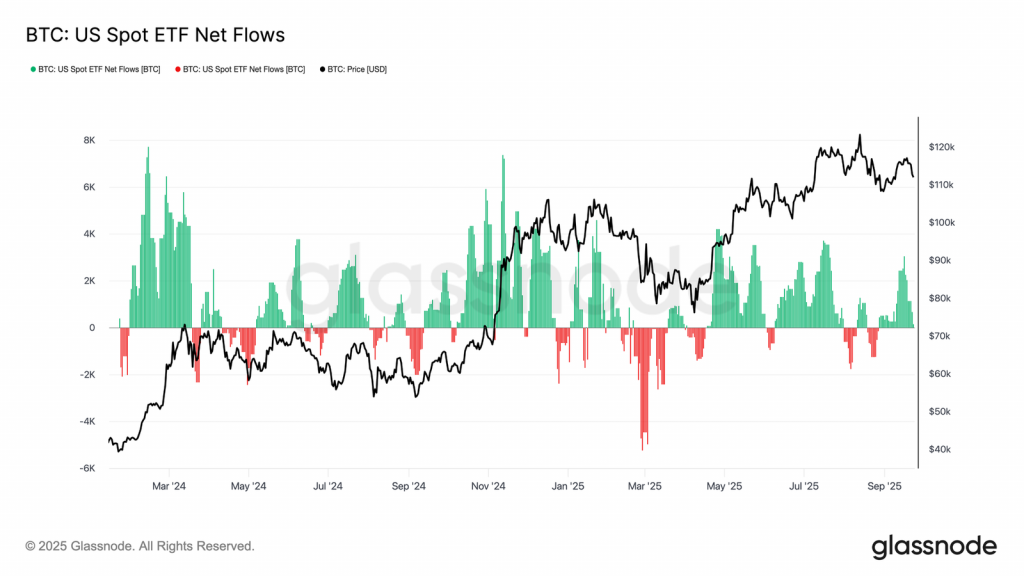
On the chart, prolonged price moves line up with streaks of inflows and outflows, while individual days barely matter on their own. The bear phase of 2026 shows this mechanism playing out on the outflow side. On June 24–25, BTC dropped to $59,023, fund outflows were in their seventh consecutive week, and AUM had shrunk to $77.5 billion, down from nearly $113 billion at the end of 2025.
The bullish impulse looks like a mirror image. In a single week in August, funds took in $1.92 billion as the price rose roughly 23%, and in a single week in September, they took in $2.4 billion.
💸 Inflows don’t offer any protection against a crash. In October 2025, record inflows preceded the crash of October 10, when about $19 billion in leveraged positions were liquidated across the market in a single day.
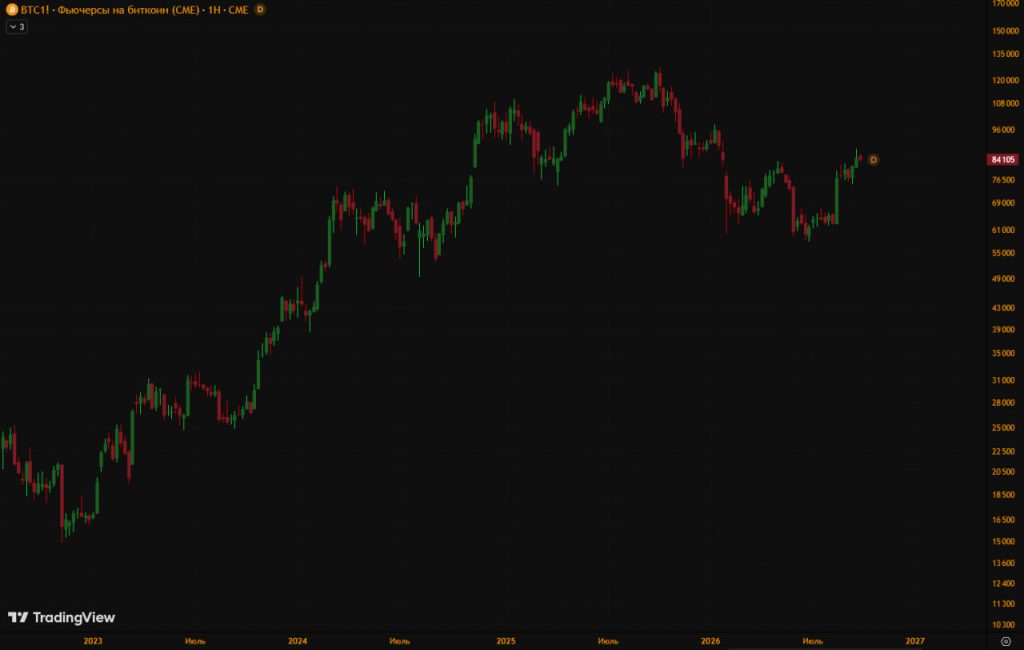
Inflows kept coming right up until the crash and did nothing to soften it. A move of that scale was driven by derivatives, and spot fund purchases couldn’t hold it back.
Why Has Bitcoin’s Volatility Fallen, and What Does That Have to Do With ETFs?
Bitcoin’s volatility is declining, and this is visible in both of its forms:
▪️ Realized volatility is calculated from actual price movements over a past period.
▪️ Implied volatility is derived from options prices, so it reflects the market’s expectations.
2025 was the least volatile year in Bitcoin’s history. In January 2026 alone, 17 new all-time lows in annual realized volatility were recorded, and in August, BTC’s 30-day volatility briefly dropped below Nasdaq’s.
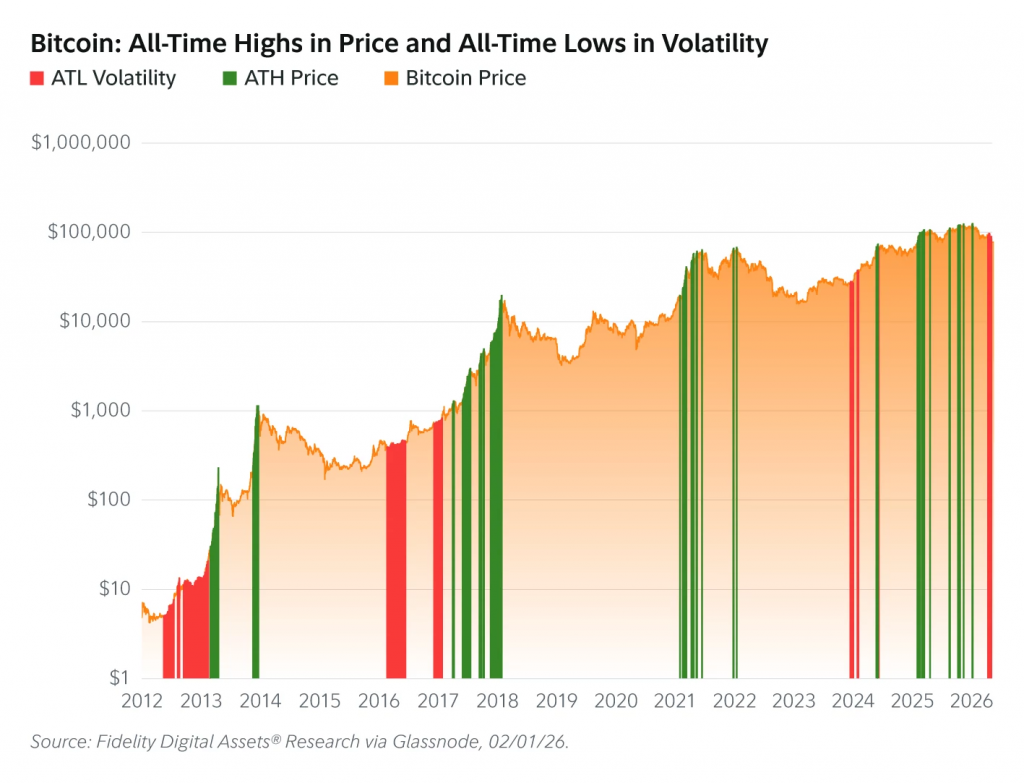
This can’t be attributed to ETFs alone. Glassnode compared 13 variables, and the one that best explains the drop in volatility is long-term holder supply — accounting for roughly 19%. Next comes illiquid supply — coins sitting in wallets that almost never sell (about 12%). The third strongest variable is coin “liveliness” — how actively old coins are moving (about 11%). Futures open interest and trading turnover turned out to be weaker factors.
📍 The connection to ETFs could be indirect: coins held in fund custody don’t move and effectively “age” over time. For now, this is just a hypothesis, and the data doesn’t confirm it.
A second alternative explanation lies with options. Implied volatility has been falling for three years now, largely due to the popularity of options-selling strategies. Banks are preparing income-generating ETFs built on exactly that kind of selling.
Low volatility is a regime, not a guarantee of anything. On August 11, monthly realized volatility stood at 27.2%; by September 7, 2026, it had already climbed to 47.25%. The jump followed an August short squeeze, when a sharp price rise forced traders betting on a decline to buy back coins en masse and close their positions.
Do ETFs Amplify Market Moves, or Calm Them Down?
The data shows two things: ETF flows correlate with price, and BTC’s volatility is falling. One explanation ties these together like this: because of how flows arrive in series, funds are more likely to amplify and stretch out price moves and shift liquidity into U.S. hours than to calm the market on their own. Stability is more strongly tied to the behavior of long-term holders.
📈 Talk of an ongoing bull market should still be treated as a scenario, not a confirmed fact. More than 71% of BTC supply is currently in profit. That’s close to the historical average of 74.7%, which has typically accompanied the transition from a bear market to a bull market. The conditions for a phase shift are falling into place, but that’s not confirmation yet.
Which ETF Flow Signals Are Worth Watching Going Forward
▪️ If inflows continue even as the price falls, that’s a sign of durable demand.
▪️ If inflows arrive alongside a low futures basis (the gap between futures and spot price), that points to directional demand, without an arbitrage component.
▪️ If new 13F filings show a growing share of advisors, capital in the funds is becoming “slower” and more stable.
▪️ If long-term holder supply falls during strong inflows, the funds are absorbing the selling of old coins, and volatility could return, as it did in the fall of 2025.
▪️ If realized volatility sits noticeably below implied volatility, the market is pricing in more risk through options than it’s actually seeing in current price moves.
Why Altcoin ETFs Haven’t Repeated Bitcoin Funds’ Success
The number of altcoin ETFs keeps growing, but the money flowing into them is noticeably smaller. In that same September week, spot Solana ETFs took in $188.2 million, and XRP ETFs took in $75.6 million — an order of magnitude less than what the Bitcoin funds pulled in.
💐 Funds without demand get shut down. Hashdex closed DEFI — the first spot BTC ETF ever to shut down — with $14.7 million in assets. Bitwise is liquidating its AETH fund: the last day of trading is set for October 2, with liquidation on October 13, 2026. Since 2021, more than 85% of closed ETFs held under $50 million in assets.
Some funds never even make it to launch. On August 7, 2026, Grayscale withdrew ETF registrations for Cardano, Polkadot, and Hedera without issuing a single share — just two days before ADA became formally eligible for expedited listing.